Browse methods / Change over time
X07 Change over time
Slope chart
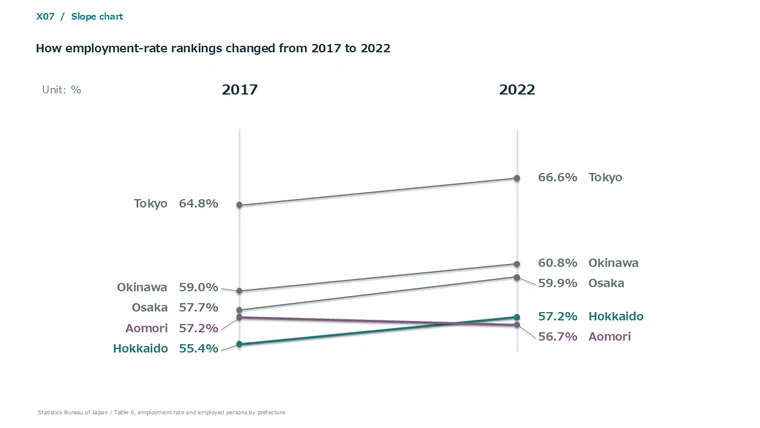
Which categories changed position or overtook each other between two points in time?
What this visual shows
Each line links one prefecture's employment rates. Hokkaido and Aomori switch positions between 2017 and 2022.
Visualization of published data
Example source
Complete guide and edit-ready files
Selection criteria, layout, expansion, full-resolution example, PPTX and AI inputs.